Adopting a Micro-frontends architecture

Screenshot 2019-04-06 at 18.19.26.png

Considering the great feedback of the first post on micro-frontends and the questions received about the approach we are taking in DAZN, I decided to share a bit more about this topic.
In this post, I am covering one of the many possible implementations of a micro-frontends architecture.

Despite micro-frontends are a new model for our frontend applications, many companies tried to embrace the principles behind them and they have created multiple implementations for solving their frontend and organisation challenges.

I think is worth mentioning some of them before jumping in how we have designed our implementation, this is not an exhaustive list but it’s interesting being aware of the different possibilities available:

— Spotify uses micro-frontends in their desktop application leveraging iframes for stitching together different part of the same view.
The communication between iframes is made via an event bus that decouples nicely the different part of the application allowing them to communicate without knowing who is going to listen for a message or event.
Also, this approach saves a lot of time on managing the application memory because every time we change the iframe location, automatically all the objects are ready to be garbage collected.

Spotify’s micro-frontends approach

— IKEA decided to implement micro-frontends with a different approach, they are using Edge Side Includes (ESI) mixed with Client Side Includes (CSI), I don’t wanna spend too many words on this technique because it’s extensively covered in Gustaf’s post but it’s definitely another opportunity for generating dynamically the content of our pages and cache the result on the CDN level or client side, depends the approach we wanna take.

— OpenComponents is an interesting framework used by several companies like Skyscanner or OpenTable. OpenComponents is an opinionated framework that is levering the concepts of an end to end components (frontend + backend together) submitted to a register and used for composing an application.
Also, in this case, we can find a lot of information on OpenComponents project website

In between those 3 implementations, we can find similar flavours with some differences used by medium-large size organisations for creating independent and technology agnostic micro-frontends. It’s worth mentioning Zalando or BuzzFeed for instance as other contributors in this school of thoughts.
If we wanna summarise the implementations we discussed till now we can list the 3 different approaches:

. using iframes + event bus
. using ESI in conjunction (or not) of CSI
. using OpenComponents or similar runtime/compile time template systems

The “DAZN way”

As I mentioned at the beginning of this post, there is another implementation to discuss: the approach taken in DAZN.
DAZN is an OTT service available in several countries that streams live and on-demand contents. Our application is available not only on web and mobile but also on smart TVs, set-top boxes and console, and that’s important to highlight because we often face unique challenges and we need to think out-of-the-box for solving them.

Usually, when we start a micro-frontends project, we should ask ourselves several questions and based on the answers facing the challenges related to our decisions, for example:

· do we want multiple micro-frontends in the same view?
· how do we route between pages?
· how do we share data between micro-frontends?
· how do we generate our micro-frontends? Runtime or Compile time?

Let’s try to answer all those questions for understanding the approach we embraced…

Do we want multiple micro-frontends in the same view?
No, we want to have 1 micro-frontend loaded per time in this way we don’t have share dependencies between micro-frontends, every micro-frontend is small enough but not too small, we have full control on the final outcome, it’s technology independent and well encapsulated.
We can potentially work with different versions of the same framework without impacting other micro-frontends or even with different technologies without any impact on the overall application.
We follow Domain Driven Design (DDD) practices for slicing our subdomains and make them really independent mapping the product teams structure and creating a vertical inside a large organisation composed by product people + frontend developers + backend developers + manual QAs + devs in test, and this is very powerful for moving fast, with different speed between teams when is needed in large companies.

Bear in mind that more often than you think, our applications are not entirely consumed by users, for instance, when the user is authenticated, all the code and the dependencies of the sign in/sign up micro-frontend won’t be loaded because we load only the micro-frontends of the authenticated area.
At the same time, when a user is not authenticated, it’s not 100% sure that she is going to finish the on-boarding journey and successfully access the authenticated area of your application, check your stats on how your users are interacting with your application and if you don’t have them invest the right amount of time on creating the right observability with tools like Google Analytics, Sentry, LogRocket and so on.
Remember, micro-frontends are helping a lot achieving the goal of loading only what the user needs and not more than that.

How do we route between pages and how do we share data between micro-frontends?
There are several ways we could achieve that, on the backend, on the edge or on the client side. We choose the client side creating an orchestrator called Bootstrap that has 4 main goals:
· route between micro-frontends
· load and unload a micro-frontend (1 per time, never multiple)
· initialize the application retrieving the configuration
· expose an APIs layer for sharing data between micro-frontends

How do we generate our micro-frontends? Runtime or Compile time?
We prefer to be very predictable with the outcome of our artefacts and we want them highly cachable like a SPA would be, therefore we didn’t take the path of creating anything at runtime, but we prefer generating micro-frontends at compile time, store them on AWS S3 and serve via Cloudfront CDN.
In this way, we don’t have to worry about scaling our infrastructure or unpredictable edge cases happening when we serve our application, we can run end to end tests and performance test before deploying in production having more confidence of what we deploy before being live.

The architecture

In our case, we decided to split the application into multiple subdomains studying upfront how our users were interacting with our web application. For green-field projects, I recommend to deeply understand how your users are going to interact with the application in conjunction with your UX and Product team and follow Domain Driven Design for defining the subdomains and their associated bounded-context.
For the DAZN application, almost every subdomain technically translates into a Single Page Application, but there are some exceptions, for instance, the video player is a component due to the broad scope of that subdomain, then those components are imported inside a micro-frontend as any other library.
Micro-frontends are loaded and orchestrated by the bootstrap, a simple vanilla javascript application embedded in the main HTML page that loads different micro-frontends based on deep-link requests, user status or any request coming from the loaded micro-frontend.

This is how our architecture looks like:

Bootstrap is always available during the application lifecycle

Bootstrap is always available during the lifecycle of our application, it’s responsible for loading our micro-frontends and exposing a tiny layer of abstraction between the device and the micro-frontend.
This detail becomes even more relevant when you target multiple devices and not only web browsers, we have our applications available on many smart TVs, set-top boxes and consoles, all of them have often different requirements and I/O APIs that defers and can be encapsulated at the boostrap level.
In this way, we can run a micro-frontend in multiple devices without the need to change a line of code because the bootstrap is abstracting the platform where the micro-frontend is running on.

If we wanna summarise how the application loads inside a browser we could say:

  1. users request our web application typing our domain in the browser
  2. bootstrap is served
  3. bootstrap initialize the application retrieving some configuration from the APIs layer
  4. based on the initial state and the user request (deep-link or default URL) load the correct micro-frontend
  5. the user enjoys our web application based on micro-frontends 🥳!

Bear in mind that every micro-frontend is independent, therefore we are not sharing components or logic across micro-frontends.
If you think it is a waste of time and effort you won’t believe how much independence every team has got thanks to this decision.

Code duplication is not always a bad practice as we have learnt in the past, often cross-team dependencies and code abstractions risk to be way more dangerous and tedious than creating 3 or 4 times the same component.
We have noticed that spending the right amount of time analysing the user flows and identifying the subdomains lead to way less duplication than expected.
Also, we noticed using micro-frontends, the dependencies across teams didn’t happen too often like in other projects thanks to the initial effort on analysing the project and create meaningful subdomains.
If in your case it’s an absolute must re-using components, there is a way to mitigate the duplication using web components for standardising the component code, with this technique, it could be reusable in combination with any framework, but this is a discussion for another post 😉.

When we started this journey into micro-frontends, for me was very clear that I had to think for the future of the development teams and not only solving the technical aspects.
With micro-frontends, we were able to provide the independence I was looking for without impacting the speed of delivery, each team is owning end to end a specific domain guaranteeing an easy way to add new functionality, fixing a bug or add an improvement without risking to have a knock out effect on the rest of the application or dependencies spread across our multiple dev centres.

Having shared those information several times with new developers joining the company as well as during my talks or online workshops I know you could have millions of questions around the bootstrap, how it loads a micro-frontends, how it shares data and so on.
I will answer all those questions in the next post that will be focused on bootstrap only so follow me for not missing this deep dive inside the micro-frontends world.

If you have any curiosity or question about micro-frontends feel free to get in touch, I’m always keen to help the community as much as I can 😁!

Micro-frontends, the future of Frontend architectures

Micro-frontends architecture

In the past 30 months, I had the opportunity to work on one of the most challenging architectures I’ve ever designed in my career.
The main requirements were based on the speed of delivery, scalability and code quality.
Frontend applications are becoming more challenging daily and achieving those requirements in a company with a massive growth like DAZN was far to be an easy task.

The first step for me was identifying how to achieve those requirements in a meaningful manner, therefore, I started thinking how I can reach those goals in an ideal world and then work retrospectively through the constraints we had inside our company.

The speed of delivery could have been achieved parallelising tasks in multiple teams the real challenge although is having teams independent enough to not be stopped by external dependencies in particular when the teams are distributed and not co-located.

Scalability on the Frontend ecosystem is not only represented by technical challenges but mainly by autonomous teams, too often I experienced the frustration of frontend developers from external dependencies and because they have to maintain and improve a codebase started for one purpose and evolved in a monster becoming unmanageable after some months or a few years of work, ideally we should be able to scale our teams organically and adapting them to the business needs without too much friction, more than being trapped inside codebases that do not really follow the “business rhythm”.

Code Quality is a non-functional requirement that is always aimed by any team and company out there but often, despite the goodwill of each team members, due to pressure from the business, we had to make some hard decisions cutting some corners so the tech debt increases and, without being addressed properly, having a knock-out effect on the entire organization and the teams morale.

On top of those key goals, a personal one I thought was key for the project I was about to redesign was innovation, in the JavaScript community there are plenty of talented teams and individuals that are contributing to open source projects with great libraries, frameworks but more in general solutions, that could make our life easier or even accelerate the time to market of specific feature, ignoring this fantastic ecosystem would have been a technical suicide considering I was working on an architecture for the future that should have remained in the company for the foreseeable future.

For achieving all of these goals I had to think outside the box, leveraging the past experiences and the learnings from successes as well as failures happened in my career.
It’s then that I thought about micro-frontends, following the microservices principles, I was able to extract a manifesto based on what I need to achieve:

DAZN micro-frontends manifesto

Usually, when we design new architecture we need to bear in mind that architecture and technical decisions are not affecting merely the code and our technical teams but also the entire organization we work for, therefore is essential understanding the impact of those choices across our company.

If you wanna learn more, I summarise this incredible journey in this talk with my colleague Max Gallo during the last edition of Frontend Developer Love Conference, the feedback at the conference was really positive, but I decided to use this platform for understanding what other people think and create a genuine discussion around a topic that is going to change the future of our Frontend applications: micro-frontends.

Enjoy the talk and feel free to comment or ask any questions, I’d really like to gather the experience and common questions/doubts of the community around micro-frontends doing my best to answer them all.

Last but not least, if you wanna learn more on micro-frontends I warmly recommend joining me the 26th April in the 3 hours online workshop organised in collaboration with O’Reilly Media

Geo-routing, A/B testing and dynamic configuration with Lambda@Edge — part 1

Working at the edge is one of the fantastic opportunities offered by Amazon and AWS Lambda is the key component for enhancing our infrastructure on the edge.
More recently many other vendors started to offer similar services like Cloudflare with edge workers for instance, in general many CDNs providers are looking to add a similar service like the AWS one.

Lambda@Edge introduction

Lambda@Edge provides you the possibility to extend the behaviours of a request or response directly on the edge.
This paradigm, in conjunction with the serverless one, can provide a great flexibility in structuring our applications and it can prevent that too many requests hit our application servers executing operations directly on the edge like headers manipulation, access control, redirection rules, images manipulation and so on.
In order to work with Lambda@Edge in AWS we just need to setup a Cloudfront distribution in front of our infrastructure, the Cloudfront distribution will allow us to setup our logic on the edge because we are able to intercept the 4 states of a request and interact with them.
In fact Lambda@Edge can be triggered at:

· viewer request: in this case the lambda is triggered when Cloudfront receives a request from a client
· origin request: the lambda is triggered before Cloudfront forwards the request to origin
· origin response: this state happens after origin replies to a request and Cloudfront receives it
· viewer response: the last state is triggered when Cloudfront forwards the response to the client.

Cloudfront is a global CDN therefore Lambda@Edge is triggered on any edge available across the world.
This means that independently from the region we set our data centre, we can manipulate or serve responses on the edge before they even arrive to our application servers.

I spent some time working on a spike for handling 2 specific features, geo-routing and a/b testing, in the mix I tried also to dynamically retrieve configurations parameters for the Lambda in order to avoid code deployment for every change I needed to do.
I’ll share the results of my spike between 2 posts, this one talks about the initial thoughts, goals and results achieved with Lambda@Edge, the second one will be more technical and I’ll explain how I configure Cloudfront, the Lambda code and setup and the overall setup for interacting with other AWS services on the edge.

Spike goals

Before we start I think is valuable understanding what I wanted to achieve with this spike, the goals are:

1. geo-routing a request to a specific static file stored in S3 bucket based on user country
2. A/B testing different applications serving always maintaining a sticky session per browser so a user always interacts with the same version
3. The previous 2 goals shouldn’t significantly impact the response time, Lambda@Edge has to be executed redirecting the user to the correct static file in 50ms or so
4. “bonus goal” is the possibility to dynamically apply different configurations without redeploying the Lambda code and without impacting too much the response time

Lambda@Edge configuration and limits

All that glitters ain’t gold! Lamba@Edge has several limitations that we need to be aware of before taking it in considerations.
In order to achieve the geo-routing we need to receive from Cloudfront the country viewer header, that will be used to determine where the request is coming from.
This header is received right after Cloudfront forwards the request to origin, we won’t receive at the viewer request state, therefore our Lambda has to be triggered as origin request.
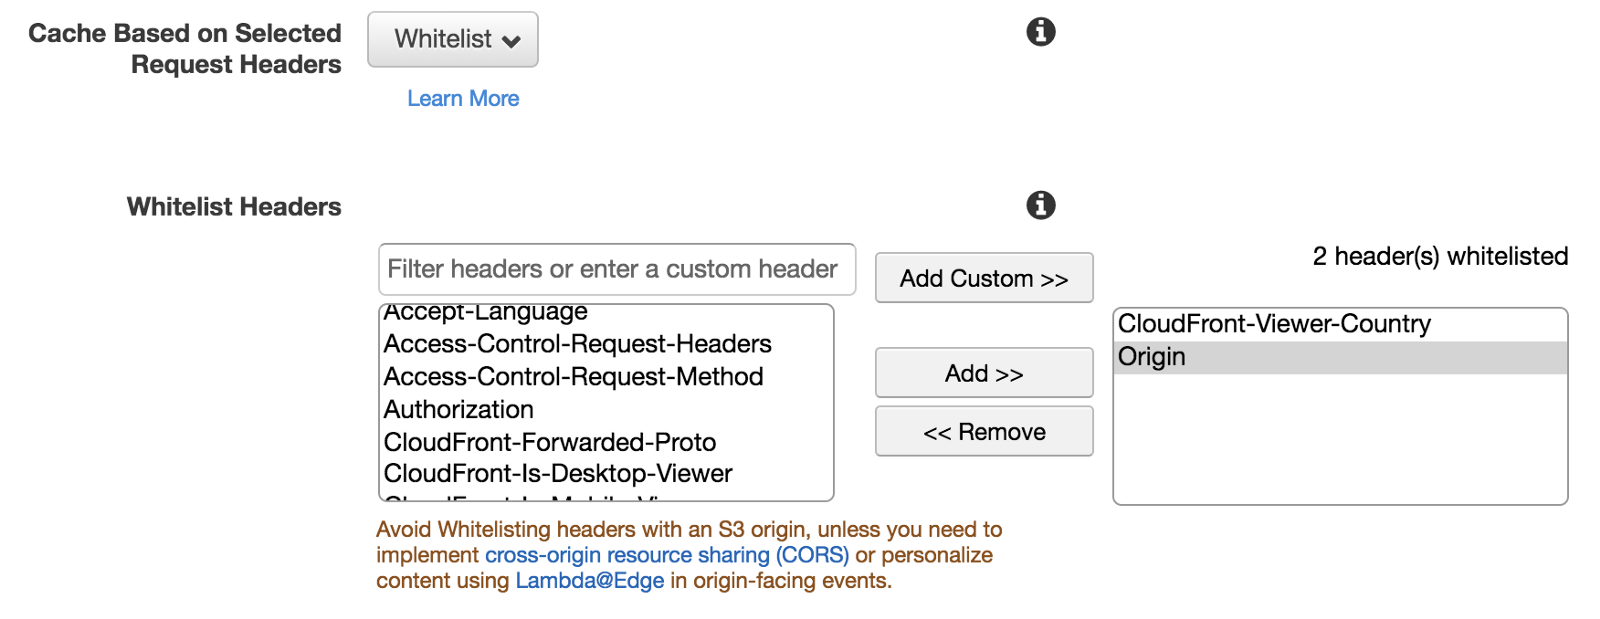
Bear in mind that Cloudfront removes all the headers if not whitelisted for increasing the response cachability, so when we configure our distribution we need to whitelist some specific headers or all of them, depends from our needs.

Lambda@Edge is a particular kind of Lambda with different limitations than the one we are used to work inside an AWS data centre.
First of all the Lambda@Edge has to be created in North Virginia only, we can associate only a numeric released with Cloudfront and not the $latestversion.
When we debug our Lambda@Edge we need to remember that all the logs in Cloudwatch won’t be available in North Virginia only but in the nearest data centre from where the Lambda was executed, for instance I’m based in London therefore during the spike, all the logs on Cloudwatch were available in the London AWS data centre only.
Finally we have also some soft limits to take in consideration like max memory associated to our Lambda@Edge, concurrent executions and so on, you can find them in the image below:

An important thing to remember is how to debug our Lambda@Edge, luckily AWS thought pretty well about this point and they provide a way to simulate an origin request customising the parameters to send it directly from the Lambda console:

Geo-routing

The Geo-routing feature was really easy to achieve considering that Cloudfront provides everything we need out-of-the-box.
After whitelisting the cloudfront-viewer-country header we can receive in our Lambda@Edge the country from where the request was coming from and we can apply the behaviour we need for that specific country.

After configuring Cloudfront distribution properly we can think about describing our behaviour in the Lambda@Edge, in this case I used Node.js for defining the logic:

These are the headers we are going to receive from Cloudfront:

As we can see the implementation is really easy despite the APIs that could have been designed in a more “friendly” way, but I appreciate they are very extensible and flexible allowing the introduction of new features and maintaining retro-compatibility.

A/B testing

For A/B testing the best way to achieve that on the edge is using cookies after select the static file to serve, also in this case we need to configure properly the Cloudfront distribution for forwarding the cookies to the Lambda@Edge:

In this spike for a specific country I was able to redirect a certain percentage of users to a static file and all the others to another one.
This mechanism becomes very handy when we want to test new versions of our web applications, so we can do a canary release and see how the new version behaves compare to the previous one.
Combining A/B testing functionality with the geo-routing feature we can deploy a new artifact in a specific country with a small percentage of users redirected to it, leaving the majority of our users consuming the previous version.
Considering we are using cookies, bear in mind that all the latest version of the browsers allow to store a cookie before doing a redirection but if you are targeting older browsers like IE 10 or similar it’s better to give it a try.
The same concern is valid if you have in your logic multiple redirections in place.

Dynamic Configuration

The bonus feature for the spike was retrieving a configuration for the URLs and the percentage of users we need to redirect on a region basis.
In this case I tried a couple of solutions, the first one with DynamoDB and the second with an S3 bucket where I stored a JSON file.
First of all I need to admit I was surprised that I was able to access a Dynamo table from the edge considering Dynamo is not global like S3 or Cloudfront, so I decided to give it a go.
I structured my table with an ID for each single information I wanted to make dynamic (the URL of an experiment, the percentage of users to redirect to a static file or the other one…) and then I tried 2 approaches, one using scanmethod and the other using get method.
Using scan was slightly slower than using get method but in any case I was over 50ms for Lambda execution therefore DynamoDB wasn’t a viable option for this use case.

I then tried a simple JSON file stored in a S3 bucket, in this case I was able to quickly configure my Lambda retrieving all the parameters I needed for changing URLs or percentage of users redirected to a specific experiment without redeploy the Lambda code.

This could look a small win but you will understand soon that for deploying a new version of a Lambda@Edge we need around 15 minutes before it’s fully propagated across the world.
Retrieving the parameters from an external file allowed to change the key part of the script in a matter of seconds, just the time to make the change in the JSON file and upload on S3.

Considering the operations we usually handle on the edge are very delicates for our infrastructure, having a mechanism to quickly change the behaviour of our logic is fundamental in particular if you are running a B2C service like in my case.

Performances

I didn’t mention in the post any metric because I wanted to gather them in a paragraph for easily compare them, so I created this table related to the executed time in each test I did for achieving the full functionality.
In the table you will see 4 scenarios:
. without any external configuration
. retrieving a JSON file from a S3 bucket
. using DynamoDB with the get method
. using DynamoDB with the scan method

I’d like to add a bit of more context just to make sure you understand how these metrics were retrieved.
DynamoDB was created in North Virginia and the Lambda was running from Europe, I didn’t try yet working with Global Tables but that will be part of a new spike I need to do in the next month, Global Tables could effectively change the execution time of the Lambda but we’ll see.
The execution time for each lambda was gathered from Cloudwatch running each scenario at least 10 times and providing the average you can see in the table.

I leave to you the considerations on the different methods used during the spike.

Useful resources

Following I gathered some useful resources for starting your journey… on the edge

Lambda@Edge limits
Lambda@Edge restrictions
Lambda@Edge pricing
Cloudfront and Lambda@Edge
Routing at the edge tutorial

Wrap up

As we have seen in this post, Lambda@Edge can become very handy for many situations, in particular for alleviating the load of our application servers.
The spike described above is just one of the many possibilities that Lambda provides on the edge, searching on the web you can find interesting tutorials like image manipulations or JWT validation on the edge, this could be just the beginning of a new way to structure our applications providing better performances and easy configurations for our web applications or APIs.
If you are wondering what would be the cost of using Lambda at the edge I leave you with this cost scenario available on the AWS website:

In the next post I’ll present how I set up Cloudfront, S3 and the Lambda code for achieving the goals of my spike, keep an eye on my social accounts 😉

Visual Studio Code extensions demystified

When I tried for the first time Visual Studio Code on my Mac I remained quite impressed about its performances.
The investment Microsoft did during the last few years on this editor is really remarkable, considering also that it’s an open source software and not a commercial one.
As you know with Visual Studio Code you can create your own extensions and then share with the community inside the marketplace.
This for me was just an interesting and quick pet project before going back the my reactive studies, but it is worth to share it

I created a simple extensions for retrieving all the annotations in my Javascript projects grouping per categories inside the output panel or in a markdown file.

vscode-annotations-panel

You can download the extension called vscode-annotations directly from the marketplace or inside the extensions panel in Visual Studio Code editor.
If you want instead take a look to the source, feel free to clone the project from Github.


extensionpanel

First steps

If you wanna quickly start working on an extension, there is a Yeoman generator provided by the Visual Studio Code team that will create the folder structure and the necessary files for publishing your extension later on.
In order to use it just run these commands in your terminal window:

npm install -g yo generator-code
yo code

During the generation, the interactive generator will ask if you prefer working with Typescript or pure Javascript, in my case I picked the latter one.
After that you will have your project ready and you can start to have fun with Visual Studio Code!
if you prefer start with the classic Hello World project feel free to check Microsoft tutorial.

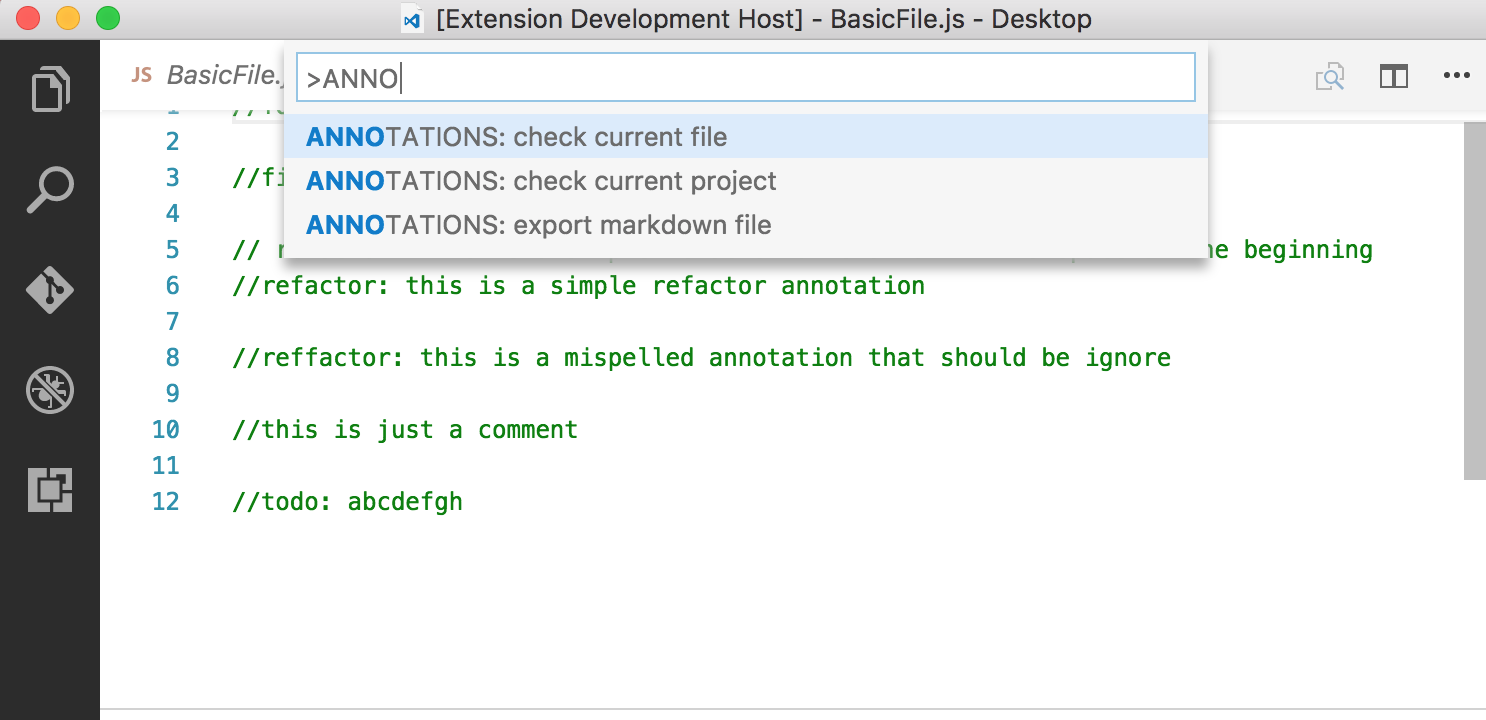
In my annotations extension what I’ve done is just providing 3 commands available in the command palette (CMD+SHIFT+P or View > Command Palette) :

. output all the annotations in the file opened inside the editor
. output all the annotations in a specific project
. export all the annotations in a specific project to a Markdown file

The first two will create an output panel inside the editor showing the annotations present inside a specific file or an entire workspace, the third one will create a markdown file with all the annotations for a specific project.

When you want to create a command inside the command palette, you need to set it up in few files, the first one is the package.json:

"activationEvents": [
     "onCommand:extension.getAnnotations",
     "onCommand:extension.getAllAnnotations",
     "onCommand:extension.createAnnotationsOutput"
 ]

and then in the commands array:

"contributes": {
    "commands": [
    {
        "command": "extension.getAnnotations",
        "title": "ANNOTATIONS: check current file"
    },
    {
        "command": "extension.createAnnotationsOutput",
        "title": "ANNOTATIONS: export markdown file"
    },
    {
        "command": "extension.getAllAnnotations",
        "title": "ANNOTATIONS: check current project"
    }]
 }

so in the commands array we are just defining the label that will be inside the command palette and the action that should be triggered when the user selects a specific command.
Then we will need to add each of them in the extension.js file (created by the scaffolder) inside the activate method that will be triggered once the editor will have loaded your extension:

vscode.commands.registerCommand('extension.getAnnotations', function () {
    // extension code here
 });

Just with these few lines of code you can see the expected results of having your commands present in the palette

vscode-annotations-palette

Microsoft is providing a well documented APIs for interacting with the editor, obviously, because it’s based on Electron bear in mind that you can also use Node.js APIs for extending the functionalities of your extension, for instance to create a file or interacting with the operating system.

Working with the workspace

When you want to interact with the editor manipulating files or printing inside the embedded console you need to deal with the workspace APIs.
In order to do that you need to become confident with a couple of objects of the vscode library:

  • window
  • workspace

With window and workspace you can handle end to end the editor UI and the project selected.
Window object is mainly use to understand what’s happening inside a file meanwhile an user is editing it.
You can also use the window object for showing notification or error messages or change the status bar

With the workspace object instead, you will be able to manage all the interactions that are happening inside the menu or editor interface.
Workspace object is useful when you want to iterate trough the project files or if you need to understand which files are currently open in the editor and when they will be closed for instance.

In my extension I used these 2 objects for showing a notification to the user:

vscode.window.showErrorMessage('There aren\'t javascript files in the open project!');

for interacting with the output panel:

vscode.window.createOutputChannel(outputWin_NAME);

[....]

outputWin.appendLine(`FILE -> file://${doc.fileName}`);
outputWin.appendLine("-----------------------------------------");
outputWin.appendLine(getBody(data, OUTPUT_PANEL_CONFIG))
outputWin.appendLine(OUTPUT_PANEL_CONFIG.newline);

outputWin.show(true);

and for iterating and opening a javascript file present inside a proejct:

vscode.workspace.openTextDocument(file.path)

[...]

vscode.workspace.findFiles('**/*.js', '**/node_modules/**', 1000).then(onFilesRetrieved)

Debugging an extension

Considering you are developing an extension for an editor you can easily debug what you are doing simply running the extension debug mode (F5 or fn+F5 from your macbook).

screen-shot-2017-01-31-at-04-06-39

Few suggestions regarding the debug mode:

  • console.dir doesn’t work, console.log will substitute what console.dir does if you are inspecting an object but not an array!
  • when an error occurs it’s not very self-explained (kudos to Facebook for the react native errors handling, best implementation ever!) so you will need to follow the stack trace as usual

Publishing an extension

Last part of this brief post will be related to the submission of your extension to the Visual Studio Code marketplace.
Also in this case Microsoft did a good job creating an extensive guide on how to do that, few suggestions also in this case:

  • in order to submit an extension in the marketplace you will need to create a Microsoft and a Visual Studio Team Service accounts
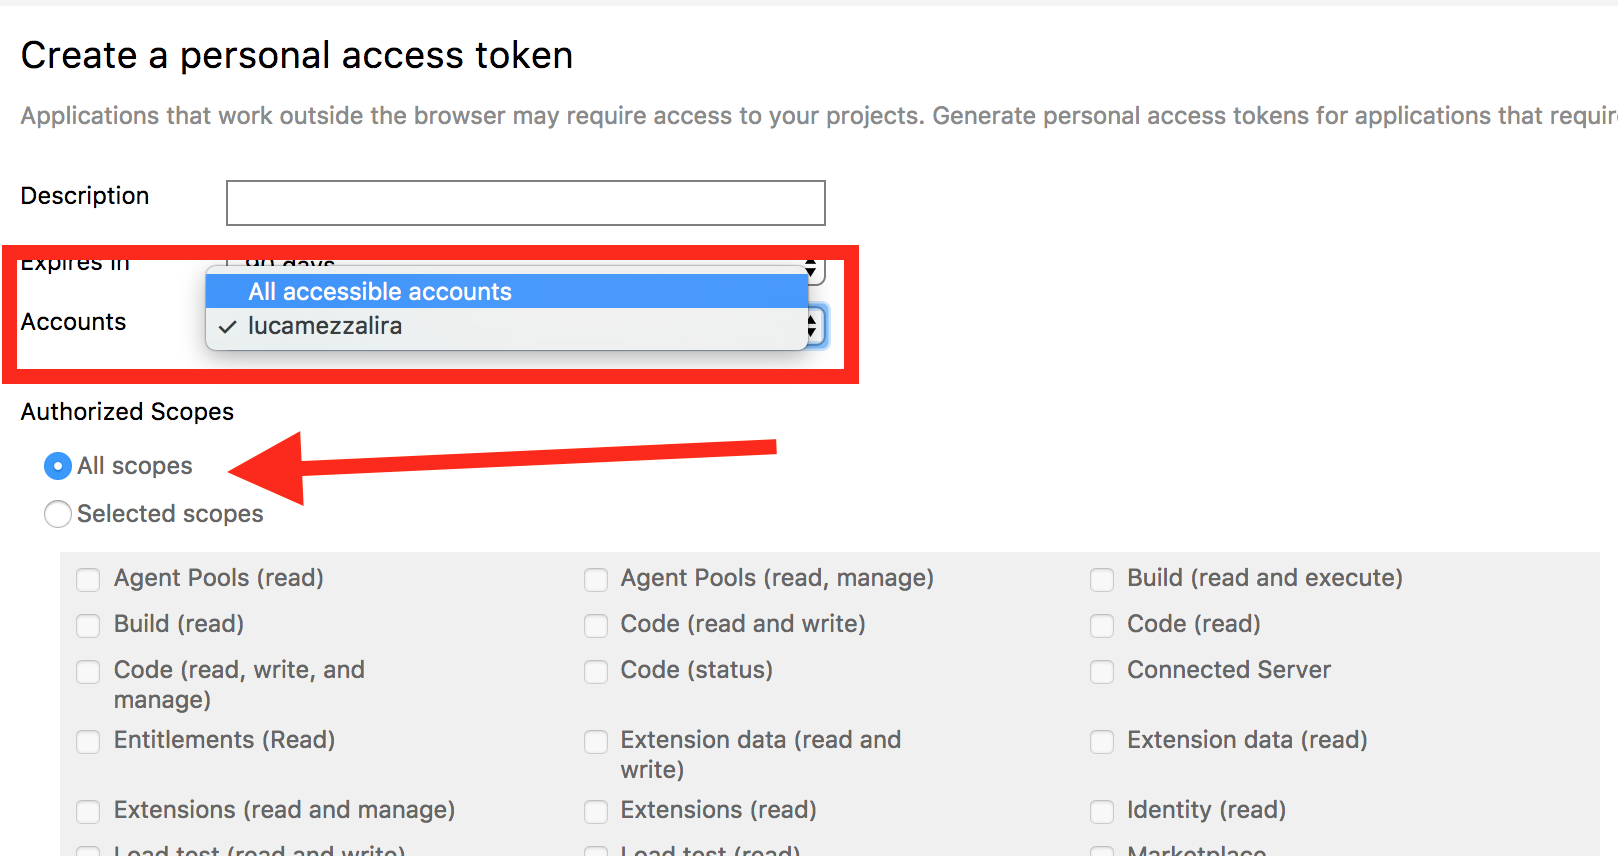
  • when you create the Personal Access Token for publishing your extension, bear in mind to set access to all accounts and all scope otherwise you could end up with a 401 or 404 error when you try to publish the extension
    screen-shot-2017-01-31-at-04-26-47
  • vsce command line tool is pretty good in order to create a publisher identity and super fast to publish an application on the marketplace.
    Considering that is a CLI tool you can also automate few part of the publishing process (increasing release number for instance) adding a scripts in your package.json
  • to make your extension more accessible in the marketplace, remember to add the keywords array inside the package.json with meaningful words and the appropriate category, at the moment there are the following categories available:
    Debuggers
    Extension Packs
    Formatters
    Keymaps
    Languages
    Linters
    Snippets
    Themes
    Other

    screen-shot-2017-01-31-at-22-14-31

Wrap up

There could be tons of other things to do and to discover for developing a Visual Studio Code extension but I think that could be a good recap of the lessons learnt for creating one that you could use along with the Microsoft guide.

Benchmarking Falcor.js

In the past few weeks I was figuring out how to solve a problem of a chatty communication between client and server considering that we are close to the release and I have already got few ideas in mind to improve the product I’m working on right now.

Thinking to possible solutions I thought to search online few different approaches that could help me out to solve the problem, at the beginning I was thinking to refactor the REST APIs in order to create them closer to what the UI needs (backend for frontend pattern) but then I remembered that I had bookmarked few projects that could help me out to implement this pattern without reinventing the wheel.
So on friday night I started to investigate Falcor.js, a library made by Netflix that was trying to solve exactly my same problem and they honestly solve the issue in a really smart way.

Let’s imagine you have a client that needs to call several REST end points in order to aggregate the data for a specific view, independently from how large is the amount of data to retrieve you have to bear in mind few other drawbacks like:

  • latency
  • no caching on specific data because they are real time data or tight to a specific user
  • amount of data to display in a view (maybe without a paging API available to split them in several views)
  • pre-flight calls for CORS end points
  • internet connection speed (mobility vs home vs office)
  • content negotiation

All of these, and probably many others, could be causes of a bad user experience and quite often we postpone to address these problems after the release of our online products.
So if we can minimise the impact in somehow we could provide a better user experience and therefore our products could be faster, more interesting and raise a good success with our users also when they have poor connection signal on their favourite device.

Here is where Falcor.js comes in support, in fact with Falcor we can minimise the amount of calls to specific end points because this library is leveraging the idea of a unique data model that could be interrogate by our clients asynchronously via Falcor APIs optimising the amount of queries to it under the hood.
The query system allows not only to fetch data from Falcor model but also to get only the data you need to use in a specific view.

services-diagram
From Falcor.js website

Looking at the image above you can spotted immediately the possible problem that Falcor solves brilliantly with a unique model.
In fact the Router is aggregating data from different end points and therefore the client can request exactly what needs in a nice and simple way.

Let’s try to explain how the system works first:

falcor-end-to-end
From Falcor.js website

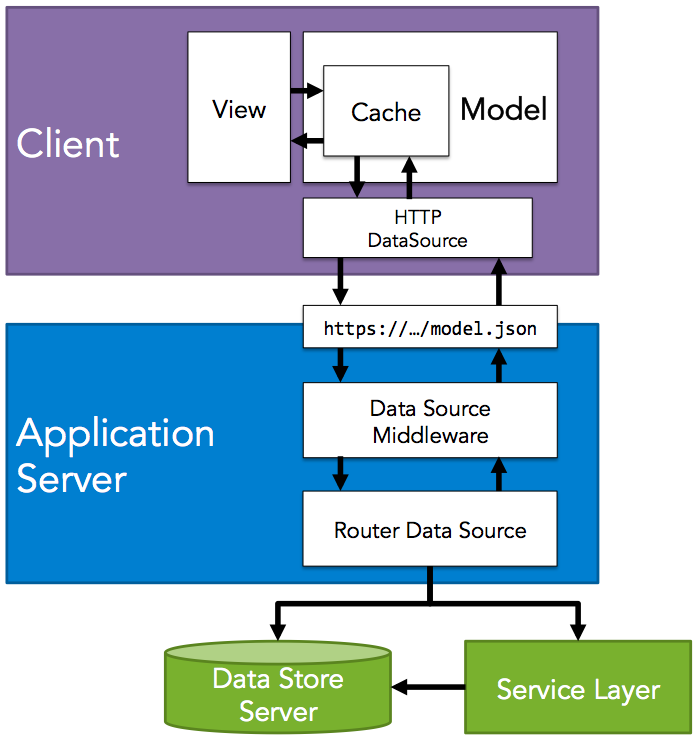
The client will create a connection to a JSON model using the HTTPDataSource provided by Falcor.js client library that will allow to start the connection between the client and the backend data model.
On the backend a Falcor router is created and inside this instance there will be the description of the different queries available and what are the data to return as router system.
Doing this each client will download only the data that effectively needs to render the page and not an element more (sometimes reducing drastically the amount of data to load).
Also each client won’t need to interrogate ad hoc services for retrieving ad hoc data created for it but will just query the same data model created for the entire application only querying different end points.
As you can see from the diagram above this part sits between the client and your backend system creating a middleware that could be use only for specific end points or for the entire application.

Another interesting characteristic of Falcor is how it can optimise the query to the data model, in fact activating the batch mode, Falcor will gather all the queries to a specific route in a tick of your application performing all of them and possibly optimising to a unique roundtrip the requests instead of multiple roundtrips!

Last but not least Falcor allows you to query the APIs implementing a paging mechanism when you are iterating elements inside lists. For instance if you have an array of elements to display in your view but the APIs provided by the backend team don’t include any paging parameter, Falcor helps you via the query system, retrieving only a certain amount of elements via the paging mechanism.

So after watching the few videos available on Falcor and reading all the documentation in the website I started to experiment directly on the chatty issue I’ve got in my project.
I can’t really share the code I’ve used for my spike mainly because I’m using the product end points but I can share with you some benchmarks and thoughts on that for now.

Currently the catalogue I’m working with is composed by 5 calls to 5 different end points in order to display THE catalogue inside the view.
There is also a timer where every few minutes these 5 calls are performed again in order to retrieve new data that possibly could refresh the products available for the user inside the page.
Obviously behind the scene the application is doing several other calls in order to synchronise its status and performing some checks, but for now let’s focus only on the catalogue part.
I extracted the 5 calls in a simple HTML page replicating the current situation in the product and gathering some metrics to understand which was the starting point and how much Falcor would be able to improve the situation.
These are the benchmark I’ve retrieved for 5 XHR calls to different end points when the data are cached and when they aren’t:

NO CACHED XHR (after 5 calls):
average time on 10 tests ~678ms
average kb on 10 tests ~111kb

CACHED XHR (after 5 calls):
average time on 10 tests ~126ms
average kb on 10 tests ~3.1 kb

Then what I did was implementing a Node.js gateway where using the Falcor Router and the Falcor model I was able to query only the data I needed (and not downloading the entire JSON with information not needed for that specific view), I’ve optimised the query to the Falcor model via batching requests and these are the results with Falcor in place in front of the product APIs:

NO CACHED WITH FALCOR (Falcor optimise the 5 calls to only 2 calls):
average time on 10 tests ~32ms
average kb on 10 tests ~5 kb

CACHED WITH FALCOR (Falcor optimise the 5 calls to only 2 calls):
average time on 10 tests ~10ms
average kb on 10 tests ~406 bytes

This is really a good performance boost considering the amount of data we downloaded by default that are now optimised via Falcor queries; several roundtrips saved because of the batching requests optimisation natively available in Falcor APIs and the nice asynchronous implementation to fetch data from the unique model.

I’ve to admit that I was really surprised and I believe sooner than later I’ll introduce Falcor.js in production because it can really simplify the pipeline of work and provide great benefits to your applications in particular when you are targeting different low end devices like in my project.
Another think that would be good to invest time on(maybe another weekend :P) is GraphQL, the main “competitor”, maybe I’ll be able to do a 1 to 1 comparison based on the same problem and see which is the best library for a specific problem.

Meanwhile if you want to start playing with it I recommend Falcor website and I encourage you to keep an eye on this blog because I’d like to share in another post more technical information about Falcor that will allow you to understand how easy is working with it.


Cycle.js a reactive framework

I had the chance to spend quite few evenings with Cycle.js preparing my presentation for JSDay 2016 and I have to admit that I had quite a lot of fun so I decided to share my experience in this post.

I’d suggest first to take a look to my previous introduction to reactive programming just to cover the basics if you are not familiar with this paradigm.

Cycle.js is an incredible light framework that allow you to work in a reactive fashion way. As mentioned on all my talks regarding this topic, the initial entry level is a little bit higher than other frameworks if you are not familiar with Reactive concepts like hot and cold observables for instance and Functional concepts like pure functions.
Cycle puts the functions as first class citizen for the entire framework, having a previous knowledge of reactive and functional paradigms definitely it helps to speed up working with this framework.
Let’s start to see how it works from an eagle eye perspective:

Screen Shot 2016-05-22 at 11.37.17

This image above represent the main concept behind Cycle where we have a loop between the a main method, that receives as input a read effects (sources), and the “external world” that receives some write effects as output (sinks).
The side effects generated by the main function will be handled by the “external world” inside drivers that will communicate with the external world.

Cycle in practice


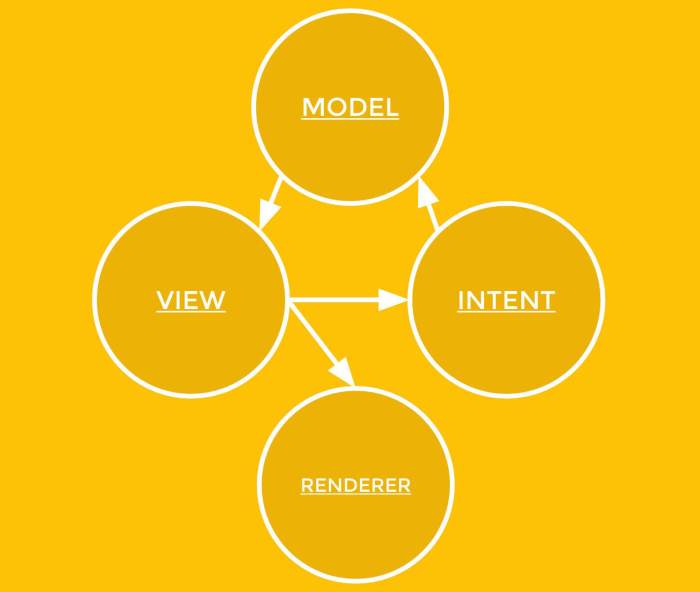
Cycle.js allows you to work with an interesting architecture created ad hoc for reactive programming called MVI (Model View Intent), I wrote an extensive article on this topic and I suggest to read it because the architecture is really interesting leveraging new concepts like the communication between objects via observables.

mvi

There is an interesting read in the Cycle website that explains how MVI works in the official website.

For the JSDay I prepared a simple example in MVI with Cycle just to show how simple is working with this architecture and with Cycle framework.
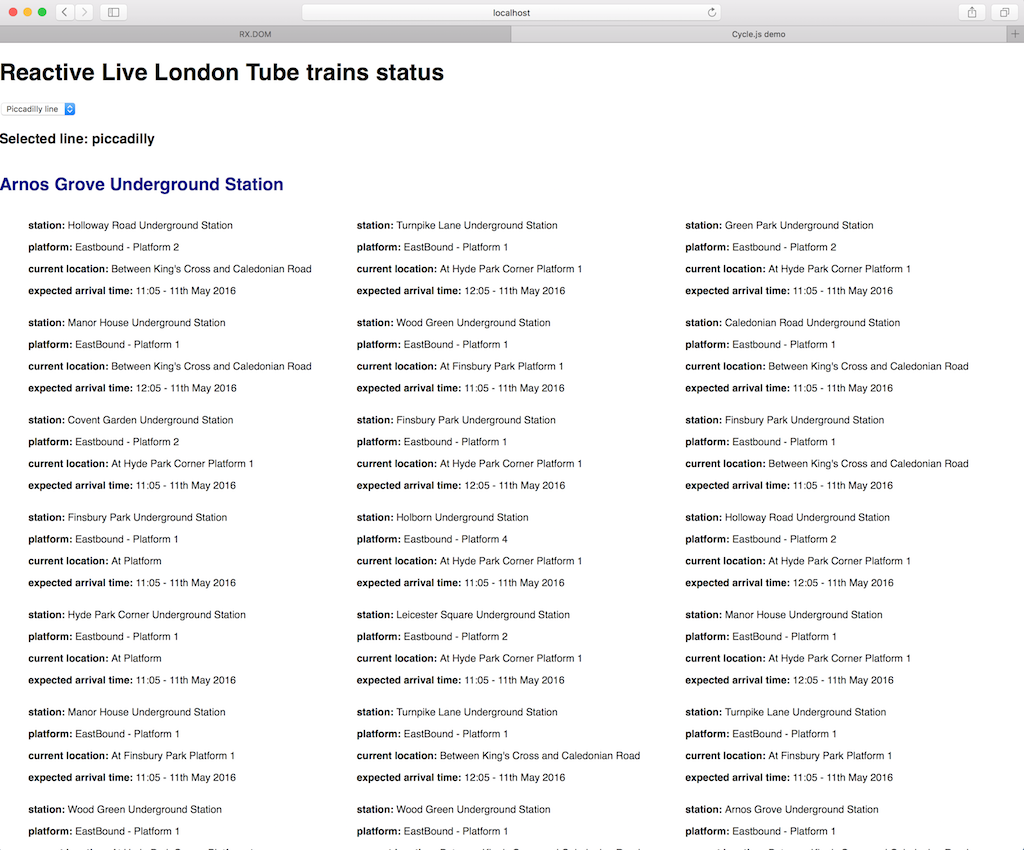
The example is a real time monitor for London Underground trains showing the position of each train and the expected arrival to their destination.

Screen Shot 2016-05-11 at 11.52.07

You can find the project on my github account

The application is mainly composed by 4 main areas:

  • Main.js is the entry point of our application where I’m instantiating Cycle run loop and I’m adding the hot reloading module for Cycle.js
  • App.js where there is the business logic of the application written in MVI (mvi-refactor branch)
  • Networking.js where I’m handling the HTTP request and response made via HTTPDriver
  • Template.js that represents the renderer object made with hyperscript (default virtual-dom library present in Cycle)

The App.js is where the business logic of the application sits with the division of competences between Model – View – Intent.
I warmly suggest to have a read to my article on MVI as mentioned before in order to understand how MVI works.

export default function app(_drivers){
   const response$ = networking.processResponse(_drivers.HTTP);
   const actions = intent(_drivers.DOM);
   const state$ = model(response$, actions);
   const vtree$ = view(state$);
   const trainsRequest$ = networking.getRequestURL(actions.line$, DEFAULT_LINE);

   return {
      DOM: vtree$,
      HTTP: trainsRequest$
   };
}

the interesting part here is how I’ve divided the interaction between different actors present in the app inside the main method.
All the constants that ends with $ symbols are observables (this is a simple convention to immediately recognise which variable is an observable and which is not).
The app method has a unique argument (_drivers) and it returns an object containing 2 observables that will be handled by the outside world via drivers (check Main.js to see where I’ve instantiated the DOM and HTTP drivers).

Then I’ve created the networking object that is handling the interaction between an end point and the application.
response$ is the observable where I’m going to store the service response and trainsRequest$ is where I’m defining the request using the tube line chosen by the user in query string (check Networking.js for that).

Last but not least I’m creating the MVI structure where the only point of communication between these pure functions is an observable or a collection of observables.
That would help me to testing easily the application, encapsulating properly the behaviours of each part and having a unidirectional flow of information that are flowing inside the application or component.

I’d like to bring your attention now to how the view is handled in Cycle.js, the view is generating a virtual tree of elements that will be rendered by a third party library like Hyperscript or React.
It’s not a case that Cycle is using a render library that implements the virtual-dom concept because, as we describe at the beginning, Cycle works with loops so having a diff algorithm that update the DOM only when needed it’s a great boost performance wise for the entire application and it removes some complexity to handle on the developers side.

export default function getBody(results){

   let selectedLine = results[0].length > 0 ? 'Selected line: ' + results[0] : "";
 
   return div(".container", [
      h1("#title", ["Reactive Live London Tube trains status"]),
      select("#lines", [
         option({ value: 'piccadilly' }, ["Piccadilly line"]),
         option({ value: 'northern' }, ["Northern line"]),
         option({ value: 'bakerloo' }, ["Bakerloo line"]),
         option({ value: 'central' }, ["Central line"]),
         option({ value: 'district' }, ["District line"]),
         option({ value: 'circle' }, ["Circle line"]),
         option({ value: 'victoria' }, ["Victora line"]),
     ]),
     h3("#selectedLine", [selectedLine]), 
     renderTrainsData(results[1])
   ]);
}

Just to give you an idea, I brought the entry function that generates the application view, after defined few static elements like the dropdown and few title elements, I’m going to call another function that is returning the results to display in the main view.
In renderTrainsData function I’m returning the elements splitting the different domain objects across 3 other functions:

function getTrainData(data){
   return li(".train", [
      div(".train-data", [
        p(".stationName .col", [span("station: "), data.stationName]),
        p(".platform", [span("platform: "), data.platformName]),
        p(".current-location", [span("current location: "), data.currentLocation]),
        p(".arrival-time: ", [span("expected arrival time: "), moment(new Date(data.expectedArrival)).format("HH:MM - Do MMM YYYY")])
      ]
   )])
}

function getDestinationStation(data){
   return div(`.destination-station .${data.lineId}`, [
       h2(data.destination),
       ul(".destination-trains-available", data.trains.map(item => getTrainData(item)))
   ]);
}

function renderTrainsData(data){
   return div(".all-stations", data.map(item => getDestinationStation(item)));
}

As you can see is very easy to understand and the code becomes very readable for anyone, in particular when we are writing meaningful function names.
I’ve created also some simple CSS IDs and classes defined as first parameter of each HTML element just for the curiosity to see a basic integration between hyperscript and CSS.

Wrap Up

Cycle.js is showing a new approach to the Javascript community with a lot of good ideas and a growing community that is following and improving the framework.
I can’t say that would be the most used framework for the next year considering how much React+Redux and Angular 2 are succeeding in the front end scene, but I believe that with Cycle you can still create great applications often with less and well structured code compared to other frameworks.
I’ll definitely continue to go ahead with it and possibly to contribute as much as I can to this project and Rx.js as well, because I strongly believe in the future of reactive programming paradigm and the people behind it.


How to Dockerize your Node application

Today I’d love to share how to wrap a Node microservice or monolithic application inside a Docker container.
I assume that you’ve already installed Docker, boot2docker and Node in your machine.
If you don’t, please check the official Docker page and Node page and after picking your operating system follow the instructions.

I’ve created a simple Node application with Hapi.js that once called returns the classic “hello world” message as response, obviously you can have a way more complex application as well, my main purpose here is talking about how to setup Docker with your Node.js application.

In order to wrap your application inside a Docker container you need to create a Dockerfile, this file is basically defining the setup for the environment where your application will run.
Checking the Docker containers currently available on Docker hub, you can see for Node the official container page that will allow you to pick the right Node version for your application.

Screen Shot 2016-04-03 at 17.01.57

As you can see there are many different Node containers available, you can also use other solution like using ubuntu, fedora or centOS as base OS where your node application is going to run but I preferred to use the official one because my server side application doesn’t require any particular configuration.
For this example we are going to use the 5-onbuild that basically is doing the “dirty job” for us, obviously this is a sample application but you can customise your container as you prefer.
What the onbuild version is doing is basically:

  • creating a directory of the application inside the container
  • copying package.json in that folder
  • running “npm install” command
  • running “npm start” command

It’s fundamental to define inside the package.json all the dependencies and the start script otherwise the application is not going to work inside the container.

Inside our Dockerfile we are going to write:

FROM node:5-onbuild
EXPOSE 8080

So basically we are inheriting all the steps described above regarding the onbuild Dockerfile plus we are exposing the port 8080 that is the one used by our Node application:

const server = new Hapi.Server();
server.connection({ port: 8080 });

It’s a best practice for any Dockerfile starting always with a FROM command and reusing the images that are already created by the community on Docker hub so remember when you want to try something different check always what’s available on Docker hub.

Good so now let’s package our container and try if it works correctly.
In order to build the container we’ll need to run the following command:

docker build -t <username>/<applicationName> .

Basically here we are saying to docker to dockerize the entire folder application (dot at the end of the command)  and the container will be called <userName>/<applicationName>
This is another Docker best practice, potentially you can call your container as you prefer but a pattern is adding first your Docker username then slash (“/”) then your application name:

docker build -t lucamezzalira/docker-hapi .

Not let’s try if it works:

docker run -p 49160:8080 -d lucamezzalira/docker-hapi

With this command we are running our container, therefore our Node application, mapping the port 8080 of the container to the port 49160 of the host.
You can check easily if the application is working correctly just typing docker ps in your console, you should see something like that:

Screen Shot 2016-04-03 at 17.29.48

So now, because I’m working on Mac, I need to retrieve the boot2docker IP and check if in the port 49160 I’m able to see my hello world application up and running.
In order to do that I’ll run the command:

boot2docker ip

That should return the external IP where my application  is running, you can also see which is the container IP using the command:

docker inspect CONTAINER ID (for example: docker inspect afb5810152f6)

The container ID is easily retrievable via docker ps (first column in the picture above).
This command will return a JSON file with a lot of information related to the container.

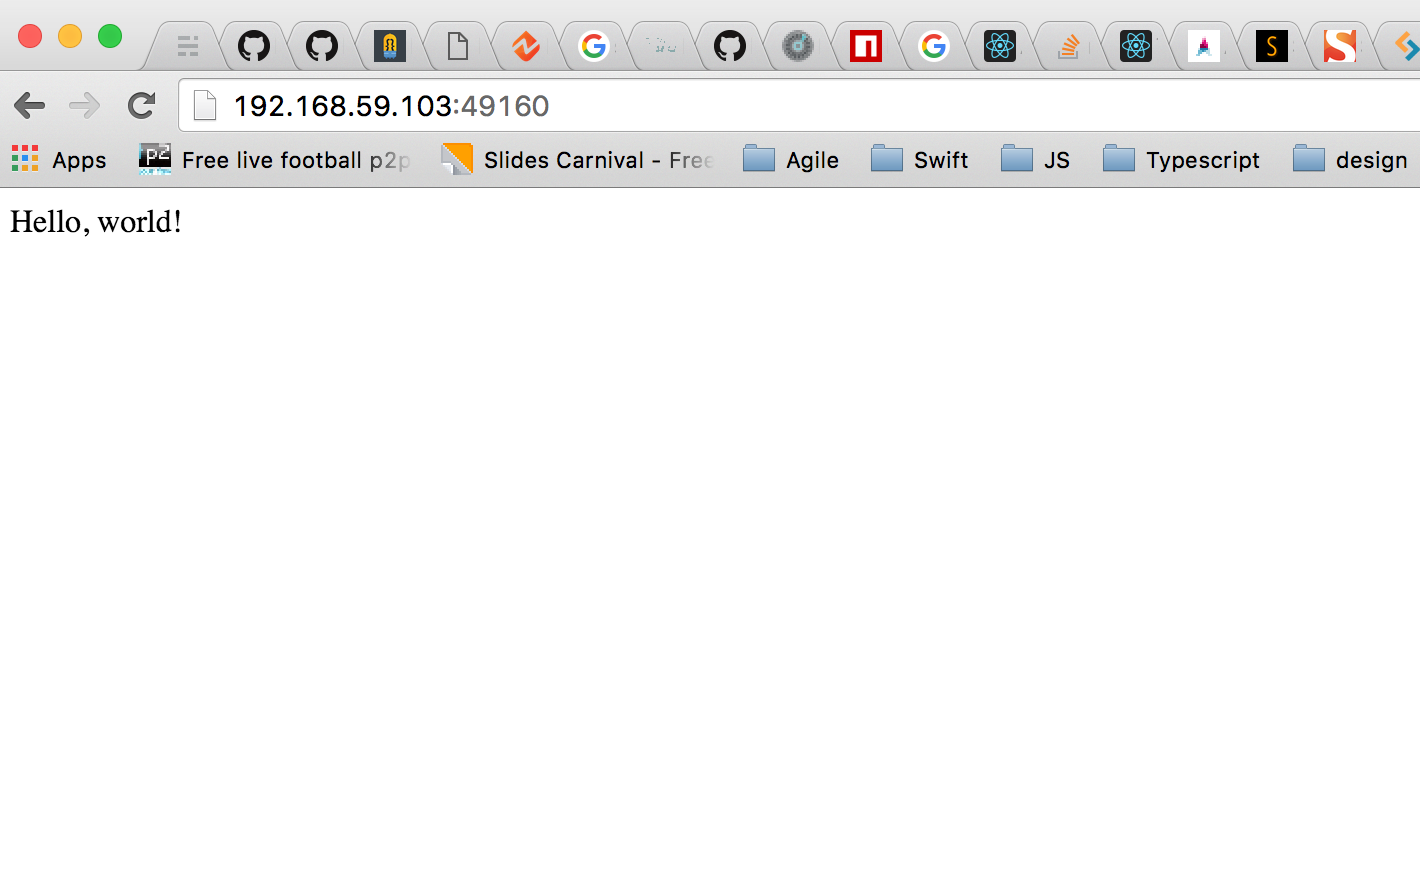
So now that I’ve the IP where my application is running and the related port  I can type inside my bowser the address and see the result!

Screen Shot 2016-04-03 at 17.36.00

Obviously you can also map that IP to etc/hosts file adding something more meaningful like boot2docker or whatever name your think is more appropriate!

If you want to download from Docker hub the container I’ve prepared for this post just type:

docker pull lucamezzalira/docker-hapi

This is a very basic introduction to Docker world and Node, I’m working on a sample microservices application that will involve few interesting concepts and pattern, so keep an eye on this blog 😉

Hot and Cold observables

One important thing to understand when you are working with Reactive Programming is the difference between hot and cold observables.
Let’s start with the definition of both types:

Cold Observables

Cold observables start running upon subscription: the observable sequence only starts pushing values to the observers when subscribe is called.

Values are also not shared among subscribers.

Hot Observables

When an observer subscribes to a hot observable sequence, it will get all values in the stream that are emitted after it subscribes.

The hot observable sequence is shared among all subscribers, and each subscriber is pushed the next value in the sequence.

Let’s see now how these 2 different observables are used across a sample application.

Using the same application I started to describe in my previous blog post, we can spot in the main class some code that is commented.
The first part represent how a cold observable works, so if you try to have the following code inside App.js you can immediately understand what’s going on when an observer subscribes to a cold observable:

let engine = new BallsCallSystem(); 
let t1 = new Ticket("t1", engine.ballStream); 

setTimeout(()=>{
    let t2 = new Ticket("t2", engine.ballStream);
}, 5000);

engine.startGame();

Our game engine instead has the following code in order to share the balls called across the tickets:

let stream = Rx.Observable
    .interval(INTERVAL)
    .map((value) => {return numbersToCall[value]})
    .take(TOTAL_CALLS);
 
this.published = stream.publish();

As you can see when we start the game there is only 1 ticket bought by the user, then after 5 seconds the user bought a new ticket and in theory we should check if in that ticket all the numbers previously called are present or not.

coldObservables
But with cold observables when an observer subscribe, it won’t be able to receive the previous data but just the data since when it subscribed, completely broken the main purpose of our bingo game… we definitely need something different in order to work with it, potentially something that won’t completely change our game logic but that could be useful to fix the issue…

That’s where the hot observables come in!
The cool part of hot observables is that you can define how much data you want to buffer inside the memory, sometimes you need to store all of them (like in the bingo game) sometimes you need only the last 4-5 occurrences, but as you will see changing from a cold to an hot observables it’s a matter of 1 line of code!

Inside the same git repo, you can find a class called BallsCallSystemReplay, this class implement an hot observable, let’s see how much the code changed inside our game engine:

this.stream = Rx.Observable
   .interval(INTERVAL)
   .map((value) => {return numbersToCall[value]})
   .take(TOTAL_CALLS)
   .shareReplay();

Basically we removed the publish method after creating the stream (that was useful if you want to control when the observable starts to stream data) and we added shareReplay that is a method that transform a cold observable to an hot one sharing all the data pass trough the stream every time a new observer subscribe to it.

So now if we change the code in App.js in this way:

let engine = new BallsCallSystemReplay();
let t1 = new Ticket("t1", engine.ballStream);
 
setTimeout(function() {
    let t2 = new Ticket("t2", engine.ballStream);
}, 5000);

Now you can see that when the second ticket is bought after the game started, we’re going anyway to check all the values called by the engine without doing a massive refactor of our game logic! Below you can see when the second ticket subscribe to the hot observable, the first thing is going to receive are all the previous values called by the engine and then is receiving the data with a certain interval following the logic of the game.

hotObservables

Reactive Programming with RxJS

In the past 6 months I spent quite few time trying to understand Reactive Programming and how it could help me on my daily job.
So I’d like to share in this post a quick example made with RxJS just to show you how Reactive Programming could help when you are handling asynchronous data streams.

If you are not familiar at all with these concepts I’d suggest to watch first my presentation on Communicating Sequential Process and Reactive Programming with RxJS (free registration) or check the slides below.

For this example I thought to create a basic bingo system that I think is a good asynchronous application example that fits perfectly with the Reactive Programming culture.
I won’t introduce in this blog post concepts like hot and cold observables, iterator pattern or observer pattern mainly because all these theoretical information are present in the webinar and the slides previously mentioned. 

You can clone the project repository directly from my git account.

Let’s start talking a little bit about the engine, basically a bingo system is composed by an engine where the numbers are called every few seconds and shared with the users in order to validate in which ticket bought by the user the number called is present.
For this purpose working with observables will facilitate the communication and the information flow between the engine and the ticket objects.
In BallsCallSystem class, after setting up the object creating few constant that we’re going to use inside the core engine, we’re going to implement the core functionality of the engine:

let stream = Rx.Observable
              .interval(INTERVAL)
              .map((value) => {return numbersToCall[value]})
              .take(TOTAL_CALLS);

These few lines of code are expressing the following intents:

  1. we create an observable (Rx.Observable)
  2. that every few milliseconds (interval method)
  3. iterate trough the interval values (incremental value from 0 to N) and return a value retrieved from the array numbersToCall (function described inside the map method)
  4. and after a certain amount of iteration we need to close the observable because the game is ended (take method) so all the observer will stop to execute their code

If we compare with an imperative programming implementation made with CSP (communicating sequential processes) I’ll end up having something similar to this one:

this.int = setInterval(this.sendData.bind(this), 3000);
[....]
sendData(){
   var val = this.numbersToCall[this.counter];
   console.log("ball called", val);
 
   csp.putAsync(this.channel, val);
   this.counter++;
 
   if(this.counter > this.numbersToCall.length){
      clearInterval(this.int);
      this.channel.close();
      console.log("GAME OVER");
   }
 }

As you can see I needed to express each single action I wanted to do in order to obtain the core functionality of my bingo system.
These 2 implementations are both solving exactly the same problem but as you can see the reactive implementation is way less verbose and easy to read than the imperative one where I’ve control of anything is happening inside the algorithm but at the same time I don’t really have a specific reason to do it.

Moving ahead with the reactive example, when we create an observable that streams data we always need an observer to retrieve these data.
So now let’s jump to Ticket class and see how we can validate against a ticket the numbers called by the engine

First of all we pass the observable via injection to a Ticket object:

let t2 = new Ticket("t2", engine.ballStream);

Then, inside the Ticket class we subscribe to the observable and we handle the different cases inside the stream (when we receive data, when an error occurs and when the stream will be terminated):

obs.subscribe(this.onData.bind(this), this.onError.bind(this), this.onComplete.bind(this));
onData(value){
    console.log("number called", value, this.tid);
    if(this.nums.indexOf(value) >= 0){
       this.totalNumsCalled.push(value);
       console.log(value + " is present in ticket " + this.tid);
    } 
 }
 
 onError(err){
    console.log("stream error:", err);
 }
 
 onComplete(){
    console.log("total numbers called in " + this.tid + ": " + this.totalNumsCalled.length);
    console.log(this.totalNumsCalled);
 }

Also here you can notice the simplicity of an implementation, for instance if we are working with React it will be very easy to handle the state of an hypothetical Ticket component and create a resilient and well structured view where each stream state is handled correctly.

An interesting benefit provided by reactive programming is for sure the simplicity and the modularity at the same time how our implementations are working.
I would really recommend to spend sometime watching the webinar in order to get the first approach to Reactive Programming and to understand better the purpose of the example described briefly above.

Scotch on the Rocks 2010

It’s finished!!! DAMN!

SOTR 2010 is end, I hope to come again next year, but now I want to share with you my experience here in London.

SOTR was organized at TigerTiger club near Piccadilly circus in the heart of London and believe me, It’s my first time that I take part in a conference where stop for a couple of days a club! That’s totally crazy, but this is SOTR and I love it! (Obviously free drink inside ;P)

Location a part, sessions were pretty cool, I really appreciate Aral and Serge one, the first was an inspire session based on clients UX and I grabbed very cool suggestions; Serge’s session was about AIR 2 and Flash Player 10.1 on Android devices… I really love those stuff!
It was impressive a performance benchmark where the same animation created with HTML and JS (7fps), another made with HTML 5 and canvas (9fps) and one made with Flash Player 10.1 (25fps !!! I really love Flash Platform) obtains different results on Android… and what results!!!

I was at SOTR also to speak about AIR 2 printing API, AlivePDF and PurePDF, I made an inspire session that allow you to have the right solution when someone (your boss maybe?!) ask you to create data reports or paper documents in a Flex RIA or AIR application.
My English a part, I think that people enjoy case history part and first twitter messages are agree with me, so believe me guys at SOTR, thank you so much for your time.
Finally in my session I shared my “thoughts” about HTML 5, Apple and so on (many photos on this slide, I was sure that you appreciate it! :D).

You can download all the stuff made for AIR & Printing session directly from this blog and if you weren’t in London and you want ask me more details about this cool shit, feel free to contact me or leave a comment at this post!

Ok, it’s time to come back to reality but before that I must say a big THANK YOU to Andy Allan that organize this amazing event, Cyril and Guust (and his girlfriend) for the great time spent together in London talking about Coldfusion and our beautiful countries.