Visual Studio Code extensions demystified

When I tried for the first time Visual Studio Code on my Mac I remained quite impressed about its performances.
The investment Microsoft did during the last few years on this editor is really remarkable, considering also that it’s an open source software and not a commercial one.
As you know with Visual Studio Code you can create your own extensions and then share with the community inside the marketplace.
This for me was just an interesting and quick pet project before going back the my reactive studies, but it is worth to share it

I created a simple extensions for retrieving all the annotations in my Javascript projects grouping per categories inside the output panel or in a markdown file.

vscode-annotations-panel

You can download the extension called vscode-annotations directly from the marketplace or inside the extensions panel in Visual Studio Code editor.
If you want instead take a look to the source, feel free to clone the project from Github.


extensionpanel

First steps

If you wanna quickly start working on an extension, there is a Yeoman generator provided by the Visual Studio Code team that will create the folder structure and the necessary files for publishing your extension later on.
In order to use it just run these commands in your terminal window:

npm install -g yo generator-code
yo code

During the generation, the interactive generator will ask if you prefer working with Typescript or pure Javascript, in my case I picked the latter one.
After that you will have your project ready and you can start to have fun with Visual Studio Code!
if you prefer start with the classic Hello World project feel free to check Microsoft tutorial.

In my annotations extension what I’ve done is just providing 3 commands available in the command palette (CMD+SHIFT+P or View > Command Palette) :

. output all the annotations in the file opened inside the editor
. output all the annotations in a specific project
. export all the annotations in a specific project to a Markdown file

The first two will create an output panel inside the editor showing the annotations present inside a specific file or an entire workspace, the third one will create a markdown file with all the annotations for a specific project.

When you want to create a command inside the command palette, you need to set it up in few files, the first one is the package.json:

"activationEvents": [
     "onCommand:extension.getAnnotations",
     "onCommand:extension.getAllAnnotations",
     "onCommand:extension.createAnnotationsOutput"
 ]

and then in the commands array:

"contributes": {
    "commands": [
    {
        "command": "extension.getAnnotations",
        "title": "ANNOTATIONS: check current file"
    },
    {
        "command": "extension.createAnnotationsOutput",
        "title": "ANNOTATIONS: export markdown file"
    },
    {
        "command": "extension.getAllAnnotations",
        "title": "ANNOTATIONS: check current project"
    }]
 }

so in the commands array we are just defining the label that will be inside the command palette and the action that should be triggered when the user selects a specific command.
Then we will need to add each of them in the extension.js file (created by the scaffolder) inside the activate method that will be triggered once the editor will have loaded your extension:

vscode.commands.registerCommand('extension.getAnnotations', function () {
    // extension code here
 });

Just with these few lines of code you can see the expected results of having your commands present in the palette

vscode-annotations-palette

Microsoft is providing a well documented APIs for interacting with the editor, obviously, because it’s based on Electron bear in mind that you can also use Node.js APIs for extending the functionalities of your extension, for instance to create a file or interacting with the operating system.

Working with the workspace

When you want to interact with the editor manipulating files or printing inside the embedded console you need to deal with the workspace APIs.
In order to do that you need to become confident with a couple of objects of the vscode library:

  • window
  • workspace

With window and workspace you can handle end to end the editor UI and the project selected.
Window object is mainly use to understand what’s happening inside a file meanwhile an user is editing it.
You can also use the window object for showing notification or error messages or change the status bar

With the workspace object instead, you will be able to manage all the interactions that are happening inside the menu or editor interface.
Workspace object is useful when you want to iterate trough the project files or if you need to understand which files are currently open in the editor and when they will be closed for instance.

In my extension I used these 2 objects for showing a notification to the user:

vscode.window.showErrorMessage('There aren\'t javascript files in the open project!');

for interacting with the output panel:

vscode.window.createOutputChannel(outputWin_NAME);

[....]

outputWin.appendLine(`FILE -> file://${doc.fileName}`);
outputWin.appendLine("-----------------------------------------");
outputWin.appendLine(getBody(data, OUTPUT_PANEL_CONFIG))
outputWin.appendLine(OUTPUT_PANEL_CONFIG.newline);

outputWin.show(true);

and for iterating and opening a javascript file present inside a proejct:

vscode.workspace.openTextDocument(file.path)

[...]

vscode.workspace.findFiles('**/*.js', '**/node_modules/**', 1000).then(onFilesRetrieved)

Debugging an extension

Considering you are developing an extension for an editor you can easily debug what you are doing simply running the extension debug mode (F5 or fn+F5 from your macbook).

screen-shot-2017-01-31-at-04-06-39

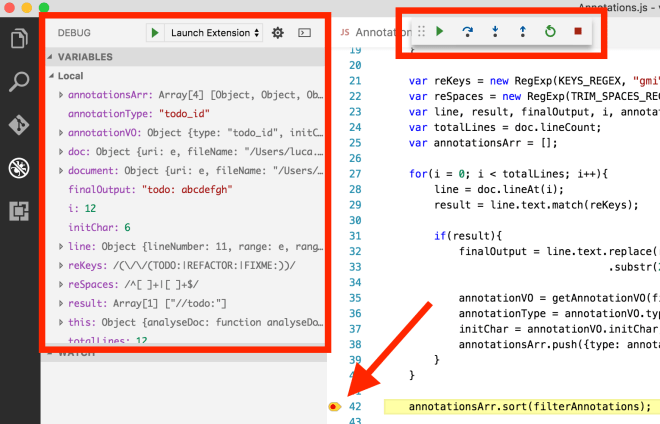
Few suggestions regarding the debug mode:

  • console.dir doesn’t work, console.log will substitute what console.dir does if you are inspecting an object but not an array!
  • when an error occurs it’s not very self-explained (kudos to Facebook for the react native errors handling, best implementation ever!) so you will need to follow the stack trace as usual

Publishing an extension

Last part of this brief post will be related to the submission of your extension to the Visual Studio Code marketplace.
Also in this case Microsoft did a good job creating an extensive guide on how to do that, few suggestions also in this case:

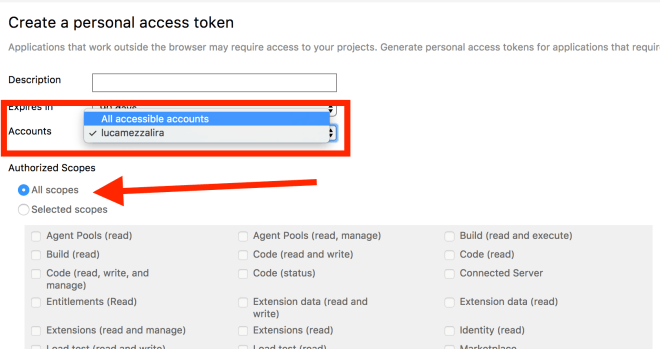
  • in order to submit an extension in the marketplace you will need to create a Microsoft and a Visual Studio Team Service accounts
  • when you create the Personal Access Token for publishing your extension, bear in mind to set access to all accounts and all scope otherwise you could end up with a 401 or 404 error when you try to publish the extension
    screen-shot-2017-01-31-at-04-26-47
  • vsce command line tool is pretty good in order to create a publisher identity and super fast to publish an application on the marketplace.
    Considering that is a CLI tool you can also automate few part of the publishing process (increasing release number for instance) adding a scripts in your package.json
  • to make your extension more accessible in the marketplace, remember to add the keywords array inside the package.json with meaningful words and the appropriate category, at the moment there are the following categories available:
    Debuggers
    Extension Packs
    Formatters
    Keymaps
    Languages
    Linters
    Snippets
    Themes
    Other

    screen-shot-2017-01-31-at-22-14-31

Wrap up

There could be tons of other things to do and to discover for developing a Visual Studio Code extension but I think that could be a good recap of the lessons learnt for creating one that you could use along with the Microsoft guide.

Advertisement

Haxe-watchify: automatic build tool for Haxe and OpenFL projects

I’ve started recently working in a new company very focused on cross platform projects with Haxe.
In my commuting time I worked on an automatic build tool for Haxe and OpenFL projects.
The tool is called haxe-watchify and with a sample JSON file or directly through the command line, you’ll be able to setup how to continuously build your project in background during your development flow.
Haxe-watchify has got interesting features in particular for the Haxe target like the possibility to setup the completion server instead the traditional compiler to speed up the building of your projects.
In fact the completion server implements a cache system to build faster your projects, in this case haxe-watchify takes care for you to start the server and communicate with it.

Currently I’ve published the tool on npm registry so in order to install it just type in your CLI:

npm install haxe-watchify -g

I wrote an extensive documentation on how to use the tool on the readme file on the project repository otherwise you can check the –help command directly on your terminal window.
I tried for now only on Mac OS X so if you find any bug in any other platforms please let me know

I’ve already thought few possible implementations to add in the next releases like a pre and post build in order to launch your tests or run static analysis tool or assets optimisation and then move to the build.
Anyway I’m very keen to learn more about your current projects workflow and how haxe-watchify could help you to improve your situation.

if you want to share any comment please do feel free to share adding a comment to this post or via email

Automate, automate and automate!

Recently I’ve spent several days on find the best way to set up an automation process for Javascript developers and I investigated several tools strictly related to the Javascript world.
These tools allow you to save a lot of time when you perform repetitive and sometimes boring tasks in order to test your HTML5 game, website or web app.
In this post I’d like to share with you what tools I’ve found and used to create a full-stack Javascript automation pipeline for any front end developer or team.

Let’s see what a Javascript developer or a team could automate in their machine to have a better code quality and to save a lot of time when they are working on their own library or projects.
For this purpose, in my pipeline, I’ve used different CLI tools like mocha, grunt, yeoman, blanket or plato.
Each of this tool allows you to perform a specific task but combined all together these tools will provide in your projects:

  • tdd, bdd and unit test
  • code coverage
  • dependencies management
  • (custom) project template
  • static analysis
  • tasks automation (live reloading, deploy in localhost folder, files concatenation…)

These are only few of the multiple options that you can have “playing” with these tools, but let’s try to go a little bit more in deep to see what tool can effectively help to accomplish each of the item present in the list above.

TDD, BDD and UNIT TEST

Surfing on the web about this topic on Javascript you’ll find really a lot of good libraries, the one I decided to use is Mocha because is very well integrated with Blanket (code coverage) and karma (tests runner) and because it’s based on node.js so you can create your libraries and then testing in pure javascript without any need to pass through HTML pages and if you need to test javascript code that will run only inside the browser you could fake the window object with libraries like jsdom integrated in your test cases.
Mocha allows you to work in BDD, TDD and in Unit Testing you can easily mix with several assertion libraries and writing also async tests became really really easy.
Other libraries that could be useful could be Jasmine or QUnit.

CODE COVERAGE

As I wrote before I found an interesting library that work perfectly with Mocha that is Blanket.js.
Blanket is very simple and easy to use library in particular when you have all your test written in modules (node.js style) instead of a mix between html and js files.
Blanket works not only with Mocha but also with Jasmine and QUnit, so basically with the most famous testing libraries!
One thing that I really appreciate of blanket is the final output that could be exported in an interactive HTML where immediately you can recognise what it’s not tested yet and jump from a file to another one following the menu on the right side of the template.
Another one that it seems quite interesting is Istanbul.js, I didn’t try yet but it’ll be the next one for sure, I heard really good experiences from other developers with this library!

STATIC ANALYSIS

When you want to use a static analysis tool in your pipeline on of the most popular is….
But I suggest to give a try to Plato in particular if you work alone or in a small team and you want to do a sanity check of your project.

8ek3snRZ22Eq898NOi-l9Dl72eJkfbmt4t8yenImKBVvK0kTmF0xjctABnaLJIm9
Plato, in fact, store all the information of your code project locally in some JSON files and you can navigate through the report directly from an HTML page created by the tool (above a screenshoot sample).
These stats are very interesting to check the are of improvement of your project and in particular with these tools you can have an immediate feedback on where your efforts should be focused in order to deliver a better product and be sure that the maintenance shouldn’t cost too much later on.
Obviously you can also use more sophisticated solutions like SonarQube and install it inside your server with the Javascript plugin and run your static analysis every time a developer push his code in git or mercurial.
Depends always the dimension of the project and the team, my suggestion is to start with Plato in a small project and then when you see the real value move to SonarQube also if you are a small organisation.r

PROJECT TEMPLATE

When you talk about template for Javascript it’s impossible to forget of Yeoman.
Yeoman is a scaffolding tool that allow you to create skeleton of project with your favorite JS library ready to use.
I really suggest to use these kind of tools because it facilitates the beginning of new projects and give you at the same time some standards inside your company and between your projects.
There are several generators ready to use and searchable from the official website, if you can’t find what you’re looking for it’s very easy use Node.JS and the APIs already built in Yeoman to create your own generator with the functionalities that your company or projects need.

TASKS AUTOMATION and DEPENDENCIES MANAGEMENT

This is my favourite part, I found in Grunt a really good tool to automate more or less everything that is not strictly related to write the project code inside my IDE!
Grunt is the glue to assembly in a pipeline all the tools explained above, easily in one line inside your CLI: “grunt”.
The community is really huge and you can find more or less everything for Node.JS or plain Javascript, from minify, uglify and concatenate your JS files, to compile your LESS or SASS files, to convert your ES6 code to ES5, to run static analysis or push your code directly on git simply with a grunt task.
One thing that I really like of Grunt is that you can easily scale the way you are working with it using a yaml file and different js files (one per task) and assembly them at runtime.
This allows to create some common tasks for the whole company and at the same time have the freedom to add custom automation for each project and/or department of your company.
I really suggest to take a look to the official website where you can find also many technical information and then start to automate your daily Javascript workflow.
Obviously if you’re not working with JS you can still use Grunt in combination with your favourite programming language or technology like Haxe, Dart, Typescript, Coffeescript or Adobe AIR; the flexibility of this tool is really impressive!

An Alternative to Grunt could be Gulp where the main difference is that grunt favours configuration over code and Gulp exactly the opposite.
The Gulp community is growing day by day and it’s interesting to see the different approach between these two great task runners, probably in the long term the Gulp approach will be more successful but for now Grunt is exactly what I was looking for.

Conclusion

As you’ve read the JS world has got really a lot of useful tool that will save a lot of time during your daily job as developer or company.
The mix of these tools allow to create a pipeline in pure Javascript and they could really improve your code quality and your flow to have standards inside yout projects and a solid flow that will able to scale your company or projects in an easy and professional way.
Obviously there aren’t only these few tools and libraries that I’ve tried, there are many others outside there that I’d like to mention like PhantomJS or Buster or Lineman and so on, but form the next five minutes before come back on what you were doing before reading this post, try to think how to improve your flow, trust me you will remain surprise on how more productive you’ll become introducing them inside your routine.